
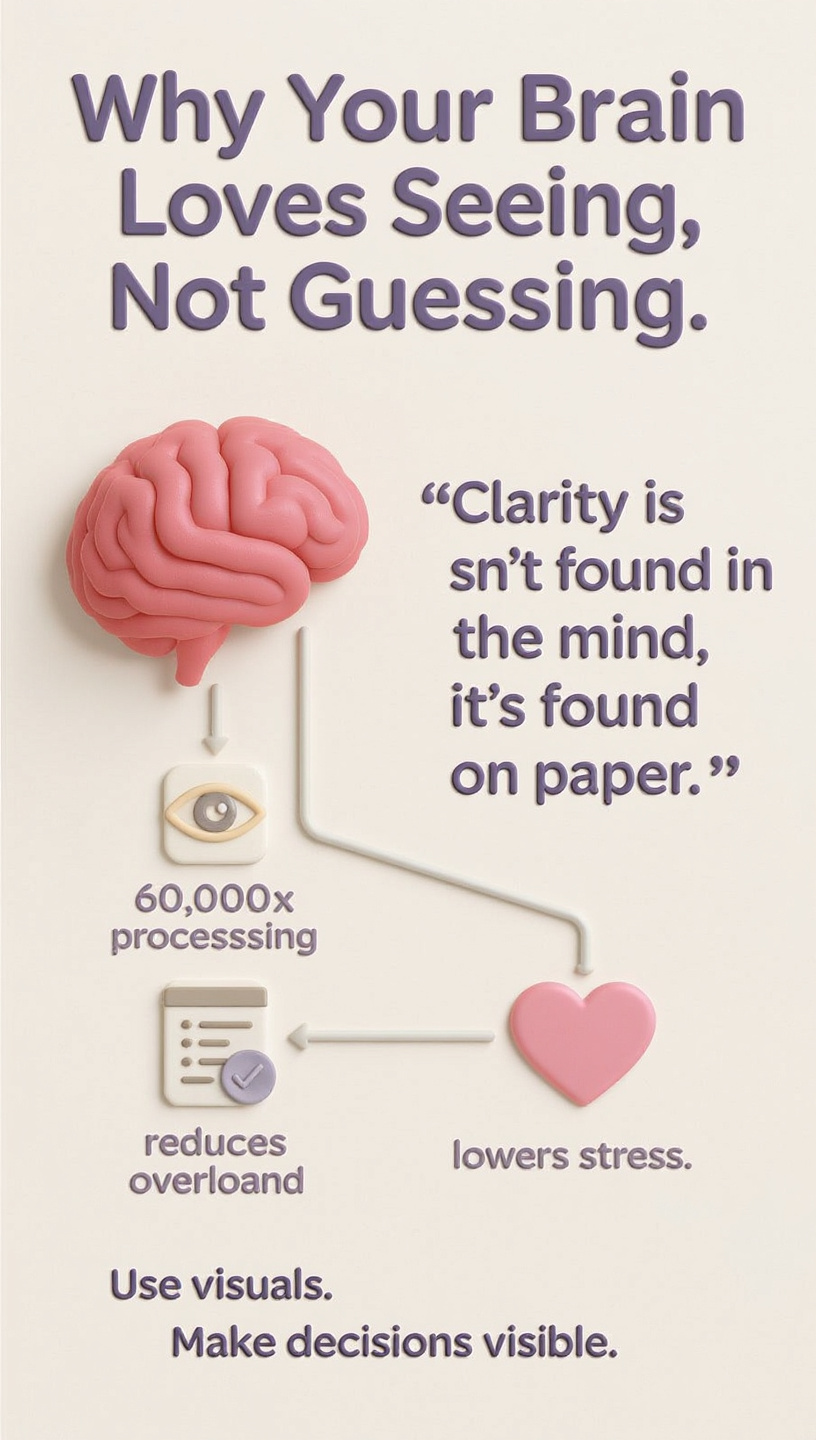
🧠 “Clarity isn’t found in the mind; it’s found on paper.”
Making smarter personal decisions isn’t about thinking harder — it’s about seeing better. Every day, we face countless choices: a new job offer, a big purchase, or a change in lifestyle. Our brains juggle emotions, facts, and fears until we hit decision fatigue — that foggy feeling where every choice feels equally confusing.
That’s where simple data visualization steps in. You don’t need to be a data scientist to use it. By turning your thoughts into visuals — with colors, shapes, or grids — you can cut through emotional noise and see what truly matters.
This guide explores four easy visualization techniques anyone can use to make more confident, data-driven decisions.
⚖️ The Upgraded Pro/Con List: Seeing the Real Balance
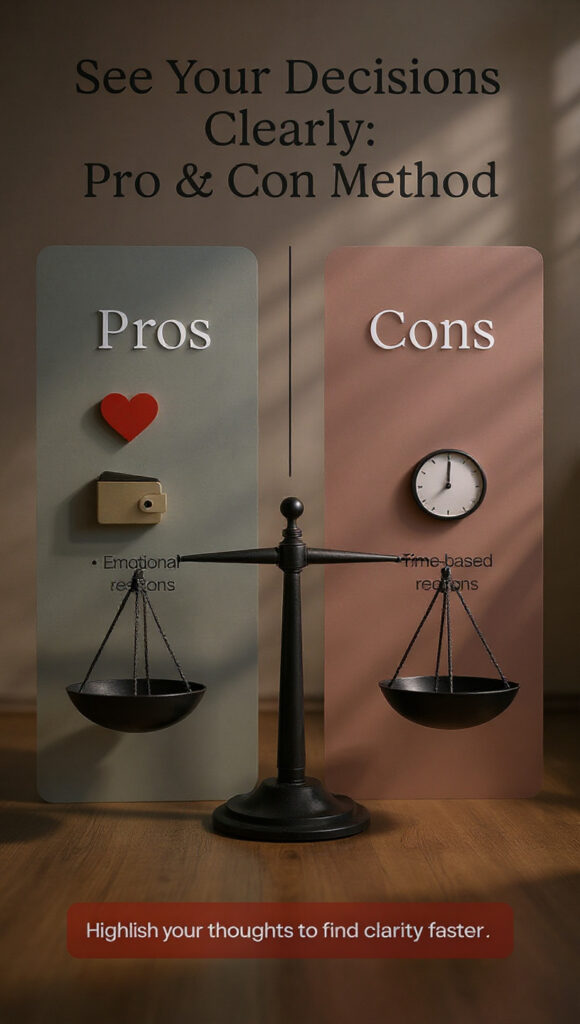
The traditional Pro and Con analysis is simple yet powerful. But when you make it visual — by adding color, emphasis, or symbols — it transforms into a quick decision snapshot.
Imagine you’re deciding whether to adopt a dog. You might feel torn between your love for pets and your busy schedule. Instead of overthinking, turn it into a visual table like this:
| Decision: Adopt a Dog | Pros | Cons |
|---|---|---|
| Companionship | Highlighted Yellow | |
| Active Lifestyle | Highlighted Yellow | |
| Unconditional Love | Highlighted Red | |
| Cost of Food/Vet | Highlighted Yellow | |
| Landlord Approval Required | Highlighted Red | |
| Less Travel Spontaneity | Highlighted Yellow |
The red highlights show deal-breakers, while yellow marks less serious concerns. Suddenly, the big picture becomes visible. You realize your real barrier isn’t the cost — it’s the lease. One conversation with your landlord could unlock your decision.
💬 Pull Quote: “The upgraded Pro/Con list doesn’t just organize your thoughts — it reveals your priorities.”
When to Use: Binary, emotional decisions (Yes/No, This/That)
Tools: Pen & paper, Google Docs table, or digital highlighters
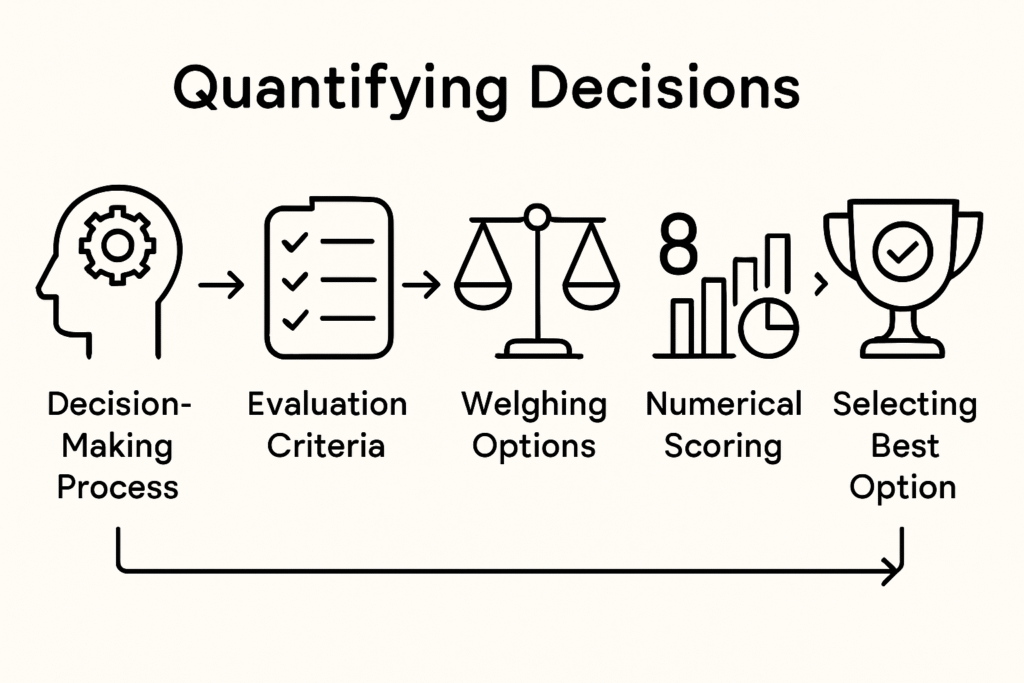
📊 The Weighted Decision Matrix: Turning Intuition into Insight
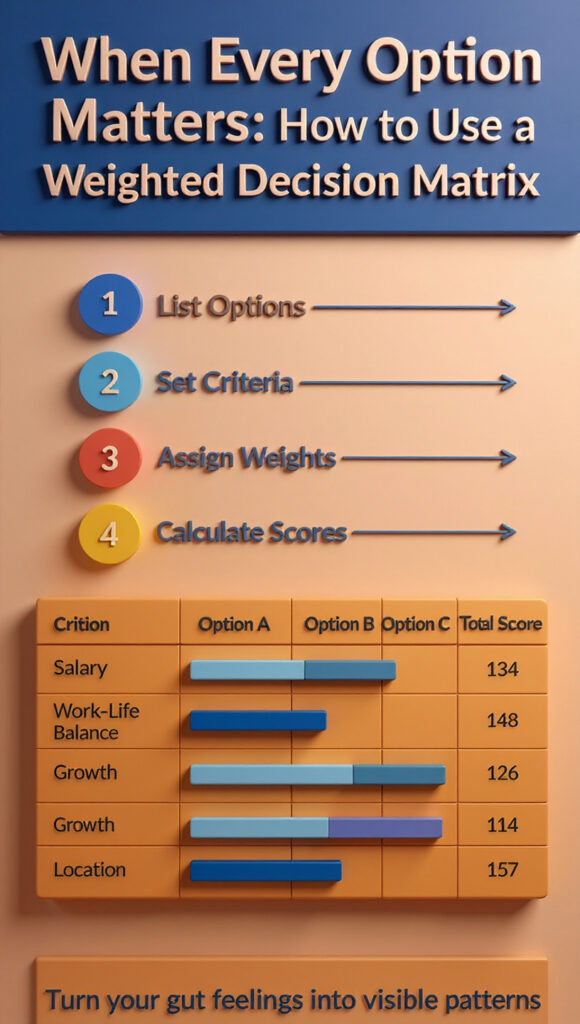
Some decisions have too many moving parts for a simple list. The Weighted Decision Matrix helps by adding structure and numbers — turning gut feeling into visual data clarity.
Say you’re choosing between three job offers. You can create this matrix:
| Criteria | Weight (1–5) | Job A | Job B | Job C |
|---|---|---|---|---|
| Salary | 5 | 4 | 3 | 5 |
| Commute Time | 3 | 5 | 2 | 4 |
| Work-Life Balance | 4 | 3 | 5 | 4 |
| Growth Potential | 5 | 4 | 5 | 3 |
| Total Score | — | 66 | 59 | 61 |
After multiplying weights by scores, the totals show which job best aligns with your real priorities — not just your emotions.
Psychological research supports this structured approach. Visual, numerical comparisons reduce decision regret because you can see your reasoning clearly.
💬 Pull Quote: “The Weighted Matrix turns gut feeling into guided logic.”
When to Use: Multi-option, complex decisions
Tools: Google Sheets, Excel, or Miro templates
🧩 The SWOT Analysis: Your 360° Decision View
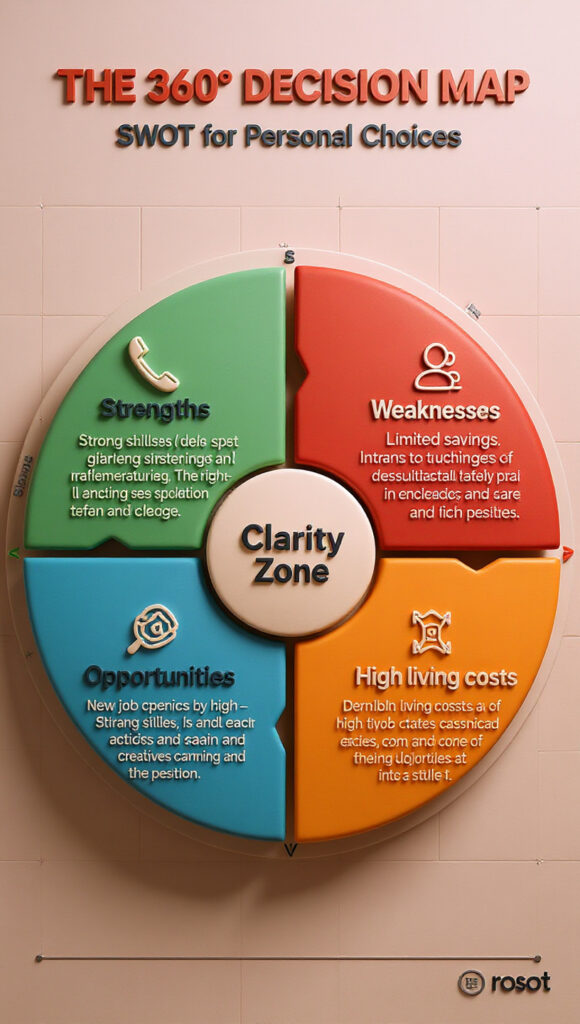
The SWOT Analysis (Strengths, Weaknesses, Opportunities, Threats) is a classic business framework, but it works beautifully for personal decisions too. It helps you explore internal and external factors influencing your choice.
Here’s how Mia, a 29-year-old graphic designer, used it before launching her Etsy pottery shop:
| SWOT Quadrant | Example Insights |
|---|---|
| Strengths | Skilled in pottery, owns a home studio |
| Weaknesses | No marketing experience, limited weekend time |
| Opportunities | Handmade goods trending, local craft fairs ahead |
| Threats | High shipping costs, market saturation |
After mapping this out, Mia realized her biggest weakness (marketing) could be countered through short online courses. The visualization gave her both clarity and direction.
💬 Pull Quote: “SWOT turns vague worries into structured insights.”
When to Use: Major strategic decisions (career moves, starting projects)
Tools: Canva quadrant templates, whiteboard, or Mural
🔁 The Simple Flowchart: Mapping the Path to Clarity
When your question is more “What should I do next?” than “Which should I choose?”, a Simple Flowchart is your best friend. It maps cause and effect through Yes/No logic, leading you to actionable results.
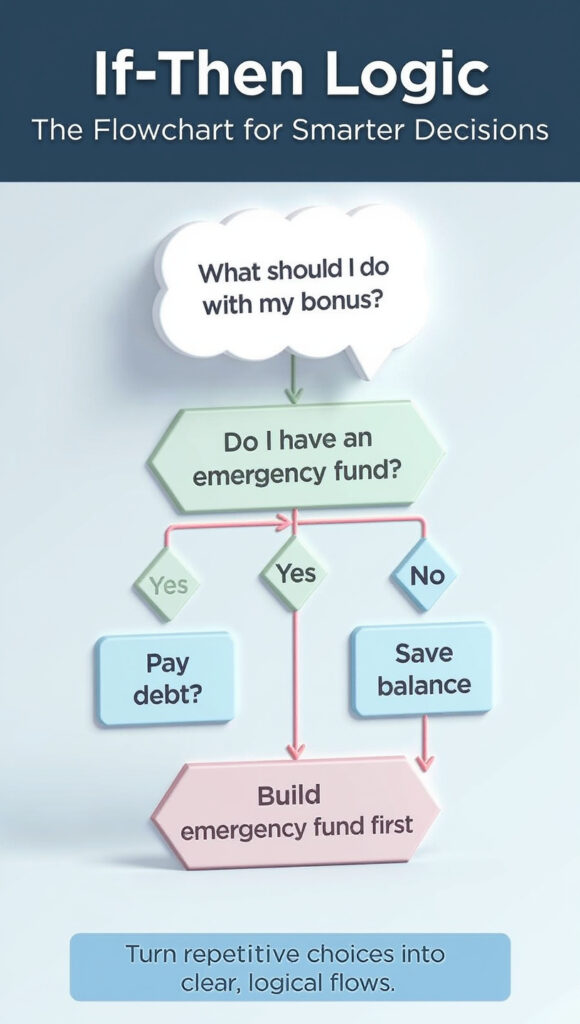
Picture Carlos, a 45-year-old accountant with a $2,000 bonus. Instead of overthinking, he creates a flow:
Start: Received $2,000 Bonus
→ “Do I have an emergency fund?”
→ No → Save.
→ Yes → “Do I have debt?”
→ Yes → Pay off.
→ No → “Should I invest?”
→ Yes → Invest in IRA.
→ No → Enjoy responsibly.
By following this chain, Carlos avoids decision paralysis and creates a plan that’s emotionally satisfying and financially sound.
💬 Pull Quote: “Flowcharts take the emotion out of uncertainty — and put clarity in its place.”
When to Use: Recurring or process-based decisions
Tools: Lucidchart, PowerPoint flow shapes, or pen-and-paper
🧬 The Science Behind Smarter Personal Decisions
Behind every visual tool lies science. Studies show the human brain processes visuals 60,000 times faster than text. When you transform your thoughts into charts or diagrams, you offload cognitive load, freeing up your mind to think critically.
This process, known as cognitive offloading, allows you to make data-driven decisions without drowning in data. Visualization helps reduce emotional bias, encourages logical sequencing, and provides a clearer picture of cause and effect.
In short, when you can see your choices, you can own them — calmly, confidently, and consciously.
🌟 Your Challenge: Start Visualizing Your Next Decision
You now have a toolkit of four visualization methods to make smarter personal decisions every day.
- The Upgraded Pro/Con List simplifies emotional choices.
- The Weighted Matrix quantifies complex options.
- The SWOT Analysis gives a 360° view.
- The Simple Flowchart clarifies the next step.
You don’t need fancy software or hours of time. You just need the courage to put your thoughts on paper and see what your mind already knows.
💡 Try this: Pick one small decision this week — what book to read, how to spend your weekend, or whether to sign up for a class. Apply one visualization technique from this article and share your result in the comments.


Leave a Reply